- Solutions
-
- File Server: Ransomware Protection
- File Server: File Copy
- File Server: Audit File Access
- File Server: Storage growth reporting
- Licensing/Pricing
- Contact
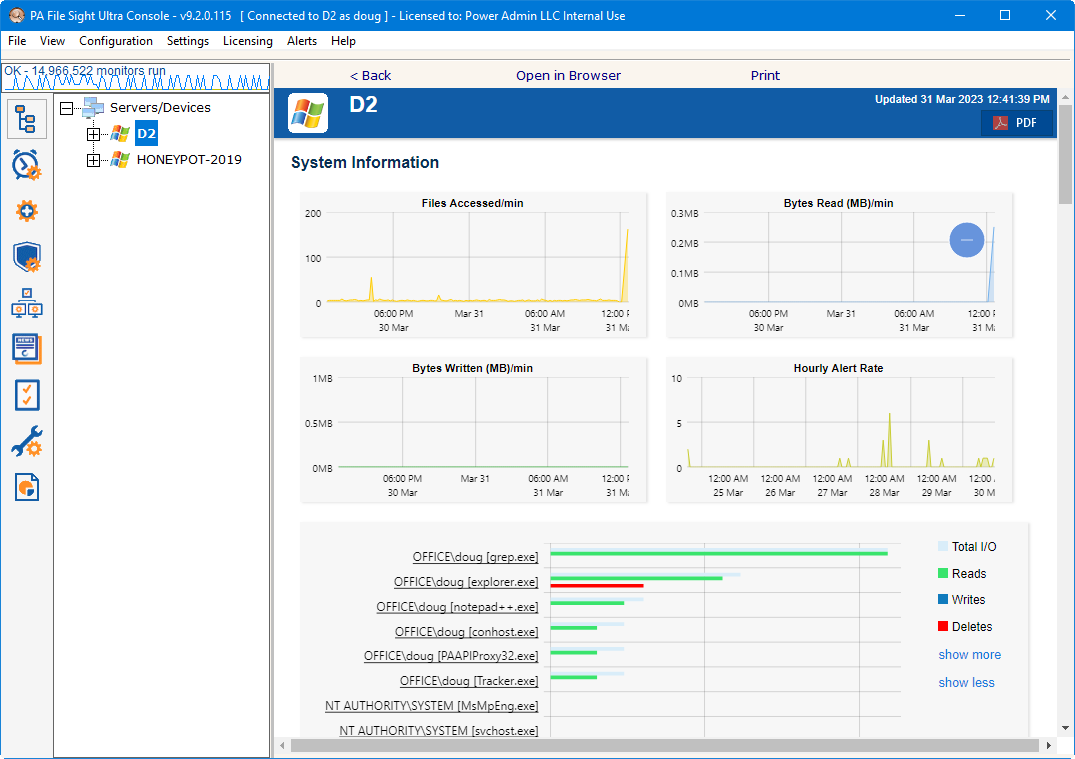
The Console is the administrative interface to PA File Sight. Some buttons that appear in the column at the left are only available if you run the Console on the same machine where the Central Monitoring Service is installed.

Activity Graph The Activity Graph at the far left is an indication of system activity. The green line indicates the number of monitors that are running or scheduled to run, and the yellow line indicates the number of actions that have run. Monitors running on remote Satellites are not represented. Double click on the Activity Graph and a larger version with more details will appear, and to view activity on Satellites.
 |
The Server/Device tree shows the groups and devices that are being monitored, as well as individual monitiors. |
 |
The All Monitors button shows all monitors grouped by type. This button can be added or removed from the View menu. |
 |
All Actions shows all actions grouped by type. This button can be added or removed from the View menu. |
 |
Advanced Services is where Satellite Services, Monitor Template Library, Global Monitors, Failover Status, Acknowledge Errors, Alert Reminder, and Event Deduplication settings can be viewed and changed. |
 |
Trusted Applications takes you to the rules, lists and warnings that make up the Trusted Applications feature. |
 |
Endpoints shows all of the options work viewing, configuring and reporting on Endpoints |
 |
News and Updates is where you can view "Updates, Tips and News" which is a great way to get information on new features and view articles that are posted on our Network Wrangler - Tech Blog site. You can also check for product updates, manage local upgrades to satellites and check for license updates. |
 |
Configuration Settings holds options for Smart Config, Bulk Config and importing and exporting the configuration. |
 |
Settings (not available in Remote Consoles) will show you options for System Settings, Database Settings, HTTP Server Settings, etc. |
 |
Reports is where you can create your own reports, create scheduled reports, view existing reports and view current system activity. |
Next to the button column on the left side is the navigation pane. Similar to many other Windows products, this navigation pane displays items that you can interact with. Right clicking most items will give you a menu of choices. Clicking a button in the column will control what is shown in the navigation tree.
The right panel displays details about the item selected in the navigation pane. Some times that information being viewed is a report, or monitor or action configuration details.
All reports that can be viewed within the Console can also be viewed in any web browser. Scroll to the bottom of the report to see the link for that report, or hit the Open in Browser button above the report.
Normally the Console is started without any command line parameters, but occasionally a command line option may be useful.
See Command Line Options for details.