- Solutions
-
- File Server: Ransomware Protection
- File Server: File Copy
- File Server: Audit File Access
- File Server: Storage growth reporting
- Licensing/Pricing
- Contact
This help page is for version 9.5. The latest available help is for version 9.7.
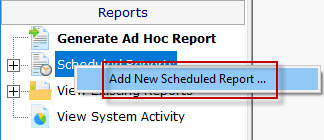
Scheduling the automatic generation of reports is similar to creating ad hoc reports. To create a Scheduled Report, go to Reports and right-click on the Scheduled Reports item.

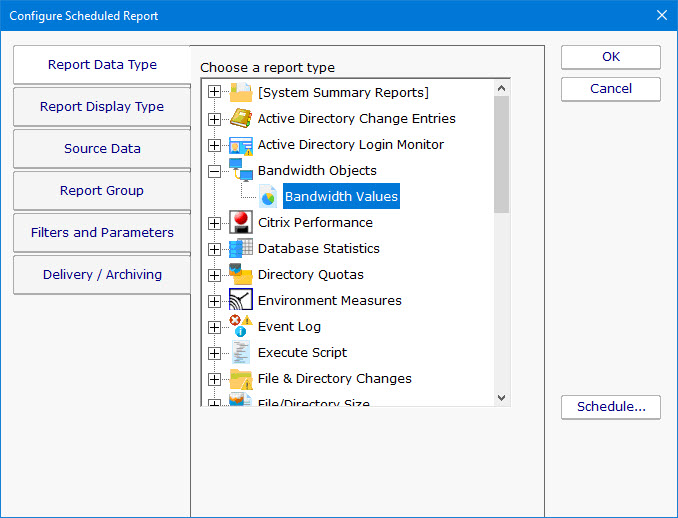
Creating a new Scheduled Report or editing an existing one will show the dialog below. (Note: The displayed Report Types may be different depending on which product you are using)
Just like with ad-hoc reports, you choose a monitor-type that sourced the data you want to report on, a report type (chart, tabular, CSV). You also choose a specific dataset to report on. Near the bottom of the dialog you specify reporting parameters that are unique to that report. More detail is given in the Ad Hoc Reports section which is exactly the same. In fact the only difference between the two is fifth Delivery/Archiving tab, and the Schedule button.

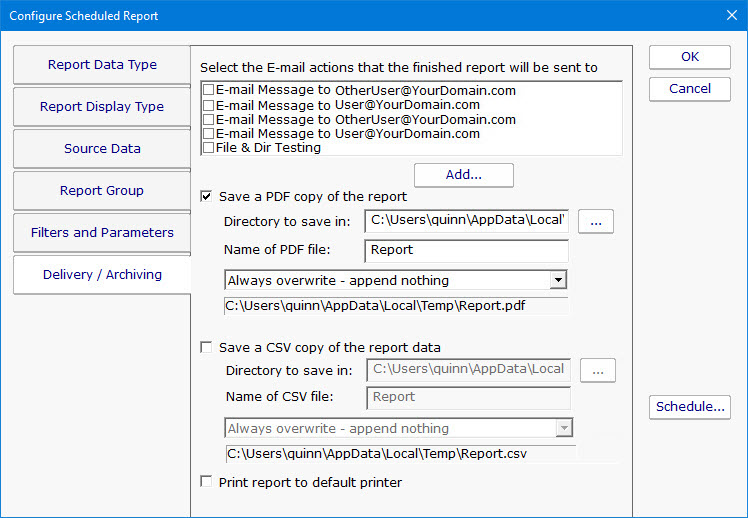
The Delivery / Archiving tab lets you specify whether to email the report when it has run. The report email will contain a PDF as well as an image of the report (raw HTML isn't sent because of varying support in email clients).
You can also specify that a PDF copy of the report get saved in a location that you specify. If specifying a remote path, use UNC paths since mapped drives often aren't available to services. When the report is archived, a unique name containing the date and time will be created if there is already a report with the same name.
At the bottom of the dialog you will see the familiar Schedule button. It works the same way as the Schedule buttons in the monitors. You can easily specify how often the report is run.

Scheduled reports always write to the same location on disk, so the URL to the report is always the same, and viewing the report in the browser will show the latest generated version of that report. This makes it easy to save the URL in your browser's Favorites list. If you want to change this behavior, see Report Settings.
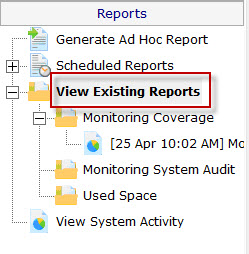
Reports that have already run are available in two locations:

If a report doesn't show the data that you expect, check the following: