- Solutions
-
- File Server: Ransomware Protection
- File Server: File Copy
- File Server: Audit File Access
- File Server: Storage growth reporting
- Licensing/Pricing
- Contact
The Server Status Report is a quick way to check basic stats on your server.
At the top right of the report are buttons to show you the reports for the group the server is part of, the index of all reports, and a button to get a PDF version of the report.
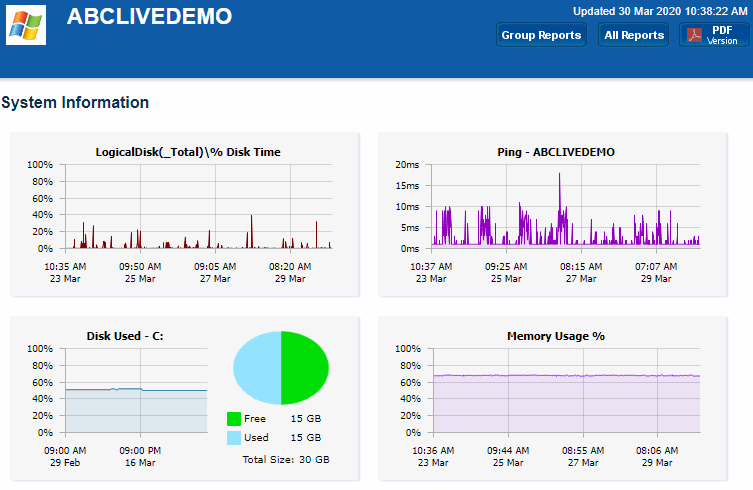
In the System Information area are some optional charts. The graphs will probably be different than the ones shown above. The charts are automatically created based on data collected by the running monitors. That means if you want to see a Disk Space chart for example, a Disk Space monitor needs to be added to the server to collect the data for the chart.
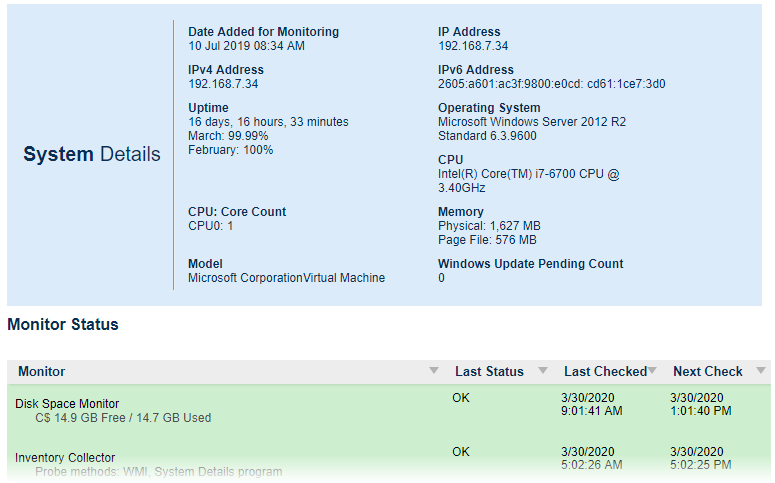
When you scroll down past the charts, there may be a System Details section. The data for System Details is collected via WMI on Windows servers. If that section is missing, look at the very bottom of the report for WMI hints. (Note: Getting WMI working can be tricky. Many customers opt to disable WMI polling completely, with the only side-effect being that the blue System Details block above is not shown. Monitoring and alerting does NOT depend on WMI at all).
The next section is Monitor Status. All monitors on the server are shown here, along with the most recent status and the next run time for the monitor. If you want to see the Last Run Time, right-click on the monitor in the navigation panel on the left side of the application.
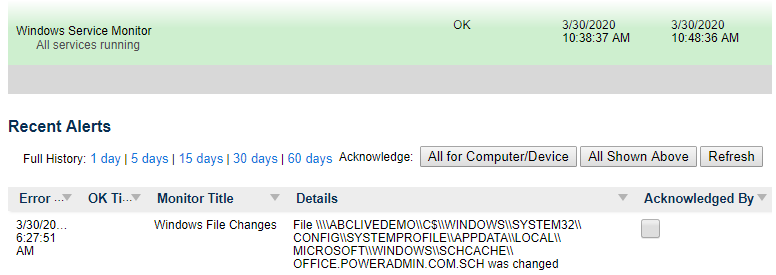
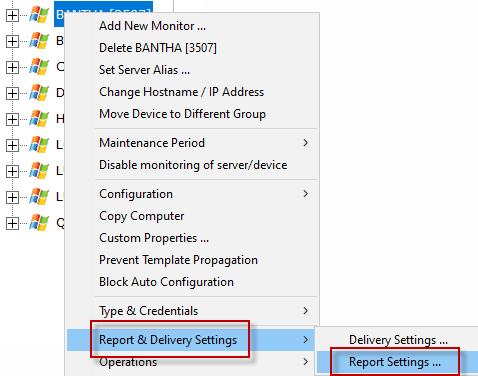
The Recent Errors section shows alerts that have recently been fired. On the right side is an optional column labeled Ack, short for Acknowledge. The Ack column is part of the Error Auditing system. You can hide or show the column and make other adjustments to the Error Auditing settings by right-clicking the computer and going to Report & Delivery Settings -> Report Settings.
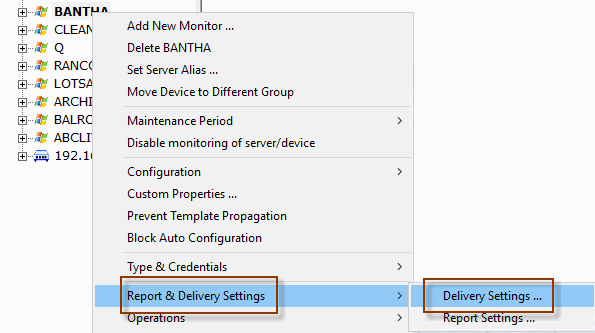
If you are using an Ultra, Pro or Lite license, you can also schedule the status reports to be emailed to you. Simply right-click on the server and choose Report Delivery Settings -> Delivery Settings.
If you are a Managed Service Provider, use Filter User Access at Settings -> Remote Access to control which servers and devices your customers can see.
In this menu you can select the sections of the server report that you want to appear, and configure aspects of each section (i.e. which charts show up.)
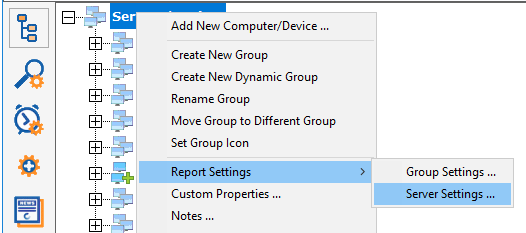
To start, you select the Group for which all contained servers reports will be edited, and right-click to choose Report Settings -> Server Settings...
... or select a specific computer and choose Report & Delivery Settings -> Report Settings.
Opening either menu entry will show you the dialogue below. Here you can drag and drop the different report sections to control whether they are displayed or not, as well as their displayed order. In this example, the Custom HTML part of the chart will not be displayed.
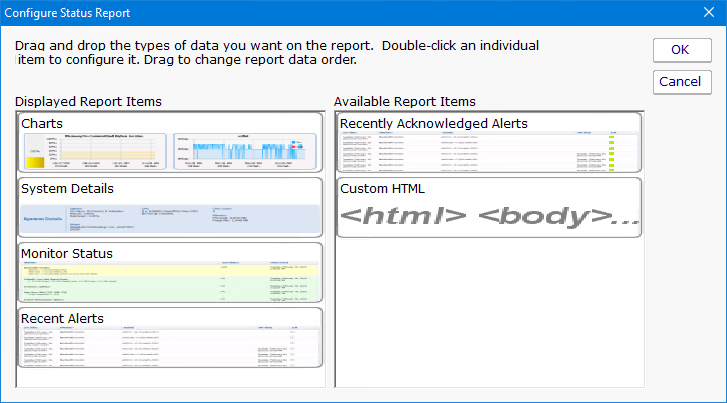
Double-click on a report item to configure settings for that report item.
Double-clicking the Charts report type will show the dialogue below. This is where you have great flexibility in defining the charts that are displayed for a server/device. Similar to the Report Parts dialog, you can drag and drop items back and forth between the right and left lists. You can also change the order of the items on the left side by dragging and dropping them.
Note: If a chart is defined, but that particular type of data is not available for a server/device, the chart will not be displayed. It's OK to define charts that some servers will and won�t have.
(Available chart types will vary based on the product and license you are using)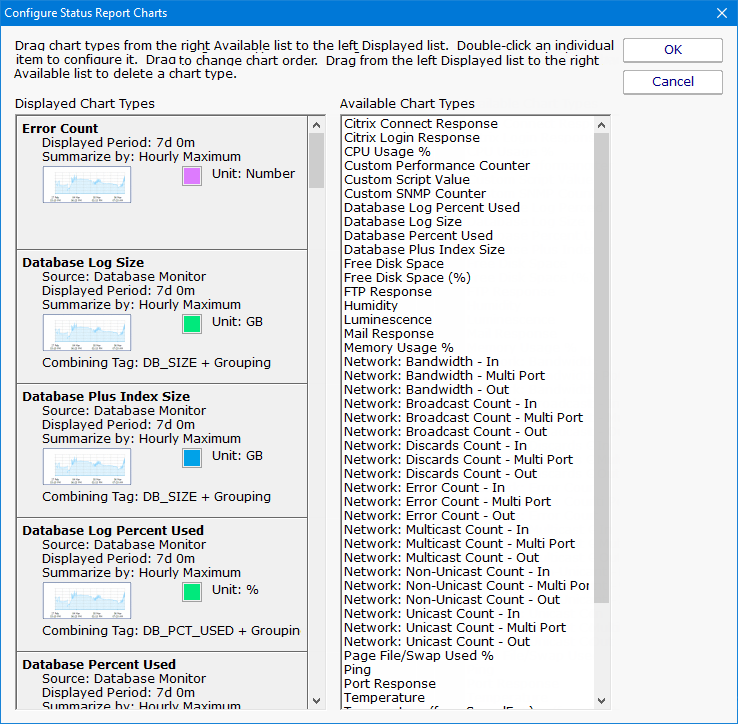
The above Configured Status Report Charts menu is an example of how the menu will appear when you select the menu from the Servers/Devices node. All of the chart types listed at this level are available to all servers/devices under this node.
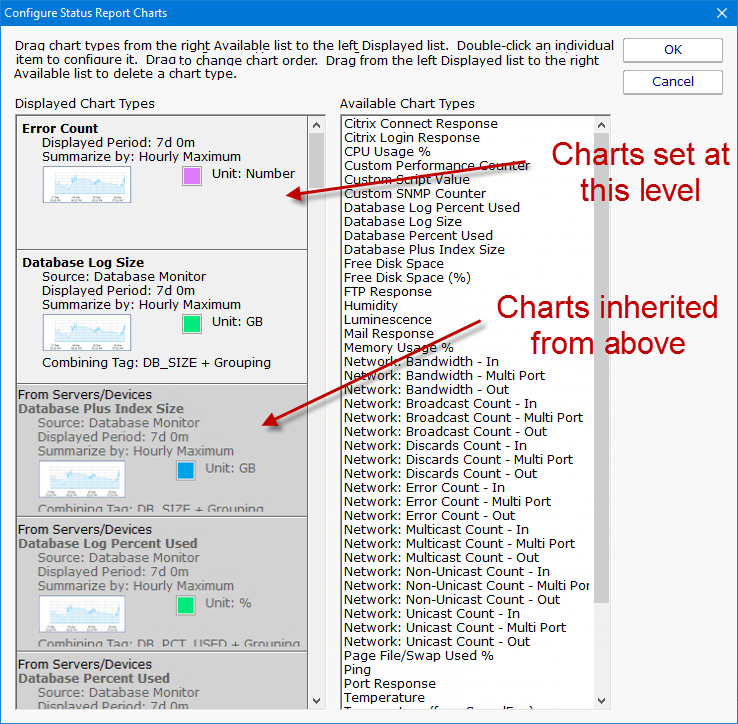
The above Configured Status Report Charts menu is an example of how the menu will appear if you select the Configured Status Report Charts menu at a group or server/device level. Note the different shaded chart types. The darker shaded charts are inherited from a group above. The lighter shaded charts are charts set at this level and will be available to servers/devices below this level.
Adding Charts - To add charts to the server status report, choose one of the chart types from the Available Chart Types and drag it to the left side. Remember that if you add a chart, there needs to be a monitor that collects the data to be able to display the chart. Edit the parameters as needed.
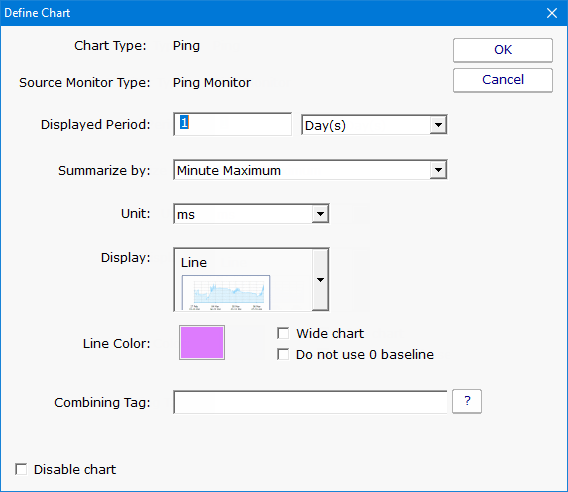
Editing Charts - Double-click on any individual chart type to change its properties, including the number of days to display, the granularity of individual data points, line color and more.
Inherited Charts - If you want to change an inherited chart type you should navigate to a higher node where it was created. If you want to disable this chart for this node and below, double click on it and check the Disable Chart check box. If you find later that you want this chart to be shown again, simply drag it off to the right side and it will be inherited again.
Custom Charts - To create custom charts, choose one of the Custom chart types (depending on which monitor is collecting the data that you want) and drag it to the left side. Be sure to fill in the Filter parameter -- this is a simple piece of text that will be matched to all statistics being monitored on the target server, and if it matches, that statistic will be charted.
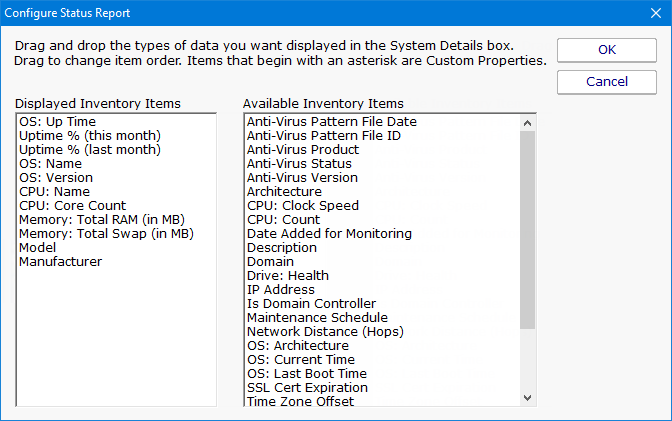
The blue System Details box can be customized to show any fields that the Inventory Collector monitor puts into the database. Drag and drop to show or hide, and to change the order of displayed fields.
The Monitor Status grid displays monitors for a server and their current status. You can configure whether a monitor's errors have to be acknowledged before it is allowed to show green after having been yellow. Also, you can select to either show the monitor's "Next Run Time" or "Last Run Time". This is part of the Error Auditing system.

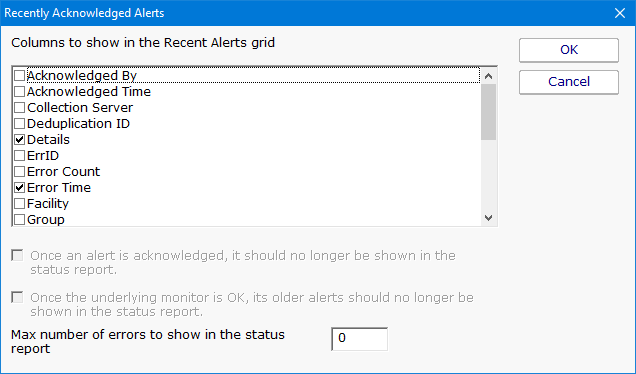
Here you specify what columns appear in the alert grid, how many recent errors to show, and whether the errors should be acknowledged or not as part of an Error Auditing procedure you might use at your location.
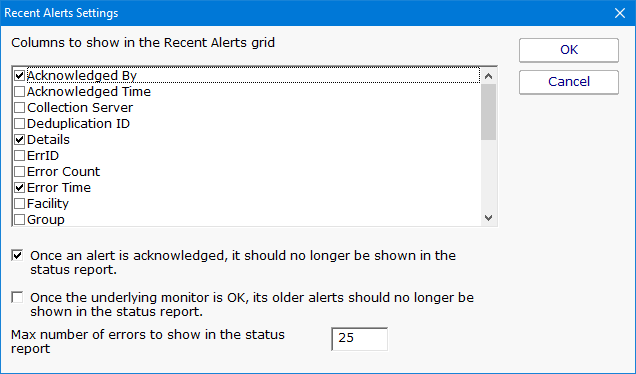
This menu works the same as the Recent Alerts menu with the exception that you can't select either of the two options on the bottom of the menu.
When this menu is double clicked a text file will open. This text will allow you to enter HTML code that will be placed on the server status page in the position listed on the left side of the Configure Status Report. To save the file, select the save option in your text editor and the page will be saved to the correct location.