- Solutions
-
- File Server: Ransomware Protection
- File Server: File Copy
- File Server: Audit File Access
- File Server: Storage growth reporting
- Licensing/Pricing
- Contact
Many of the monitors (Ping monitor, Web Page monitor, Service and Process monitors, etc) support an Uptime Report.
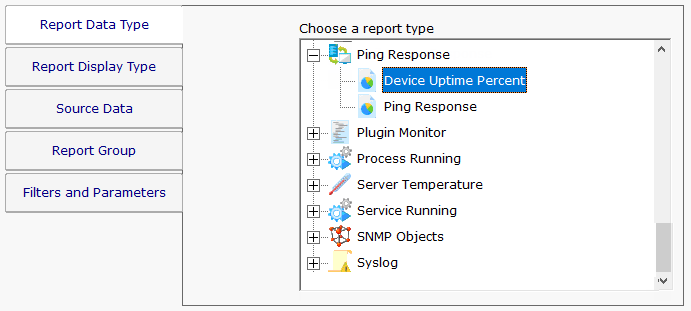
Most of the Uptime Reports let you define what 'up' means. In the case of monitors that collect timing data like the Ping monitor and the Web page monitor, you define up in terms of response time. For example, you might define 'up' as being a response within 500ms.
When running an Uptime Report, it is important to understand the data summarization choice. Basically the data that you choose is grouped into periods that you choose, and a value is derived from each group. Periods can be Hourly, Daily, Weekly and Monthly, and the grouping operation can be Minimum, Maximum and Average. So for example:
Daily Average: Take the average value for each day
Hourly Minimum: Take the minimum value for each hour
Monthly Maximum: Take the maximum value for each month
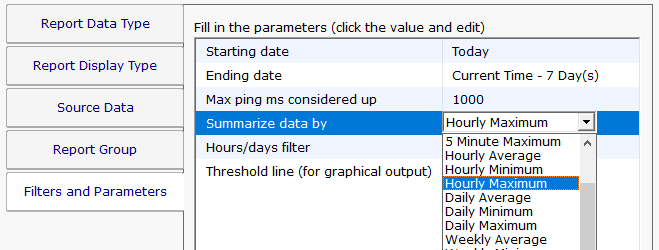
With Ping for example, a lower value is typically better, so you would typically want to see the Maximum value (ie, run a report to see the worst performance in a period). Looking at the Minimum might be hiding a lot of bad values that occurred. So if there was a single value of 1 ms in the time period, the Minimum would return that value, making the time period look good. On the other hand, if there was a single value of 800 ms in the period, that value would be returned with the Maximum selection, indicating a problem in the time period.
One thing to keep in mind a very high sentinal value used by some monitors (Ping and Web Page monitor specifically) that is used to indicate a failure to get any response at all. For Ping, this value defaults to 30,000 ms. For Web Page, it is 90,000 ms.
When you run an uptime report, you can output the data in tabular form, bar chart or line chart. In these cases, 'up' is the value 100, and 'down' is the value 0.
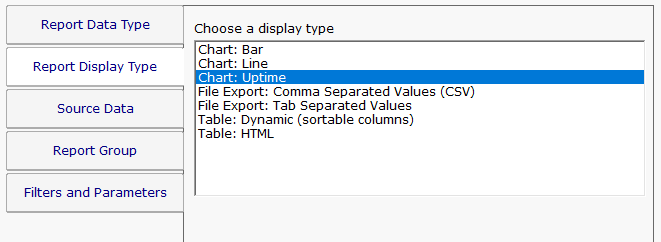
You can also choose to output the report as an Uptime Chart. This is a bar chart that shows 100% up with a bar going all the way to the top. If there was a down even, a red diamond is shown. If the monitor didn't run at all during a period of time, there will be no bar for that period.
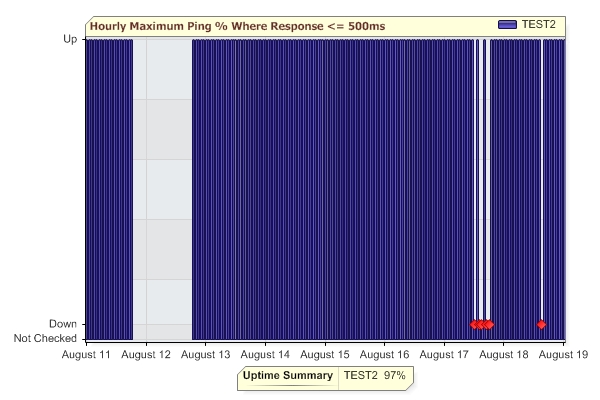
The report above indicates monitoring was stopped around August 12th for about a day, and a few down events that occurred on August 17th and August 18th.
The Uptime Summary statistic is shown at the bottom of the Uptime Report. The value is calculated by tallying up each measurement one minute at a time across the entire time range. If there are multiple values for a minute, those values are averaged. If there is a minute with no data, the value for the previous minute is used (this can take place for multiple minutes with no data). Each minute's value is compared to the 'up' definition and assigned a value of 100 (100% up for that minute) or 0 (completely down for the minute). Then the average across the whole time range is computed and displayed.
Note that the Uptime Summary DOES use the definition of 'up' (ie < 500ms in our example), but it does NOT depend on the Hourly/Daily/Weekly/Monthly or the Minimum/Maximum/Average charting choices -- it attempts to give the true uptime over the specified period.
For example, look at the two charts below. The chart on the left uses Hourly Minimum, which means if there is a good ping response in the hour, the whole hour is recorded as 'up'. The chart on the right uses Hourly Maximum -- if any ping is over the threshold, that hour is shown as 'down'. Although the charts look different, the Uptime Summary statistic is the same in both.
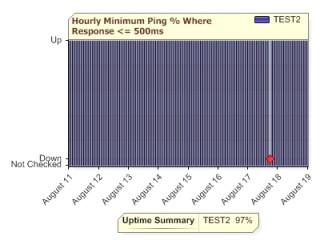
|
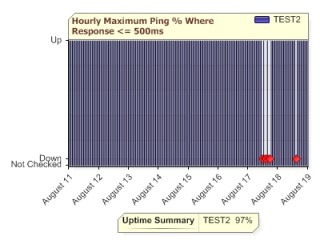
|
CAVEAT: Note that the Uptime Summary assumes that the monitor was running for the entire time. If monitoring was stopped, that can show up in the chart, but the statistic will use values from the previous minutes in the calculation.