- Solutions
-
- File Server: Ransomware Protection
- File Server: File Copy
- File Server: Audit File Access
- File Server: Storage growth reporting
- Licensing/Pricing
- Contact
The Performance Counter Monitor can watch any performance counter that the Windows Perfmon tool can display. This gives you great flexibility since many systems and drivers on the computer report statistics and their current state via the performance counters.
In addition, CPU and memory usage counters are simulated for Linux/Unix machines via SNMP, and via VMWare interfaces for ESX servers, and via IPMI for those devices such as the Dell DRAC/iDRAC and HP iLO. Monitoring and charting those values is now as easy as with a Windows server.
Watch the training video How to Monitor Memory or How to Monitor CPU.
This monitor supports retrieving and monitoring counter values for:
Make sure the computer's Server Type is set correctly, and that the appropriate credentials (Windows, SNMP, ESX, IPMI, AWS) exist to allow the monitor to access the performance counters.
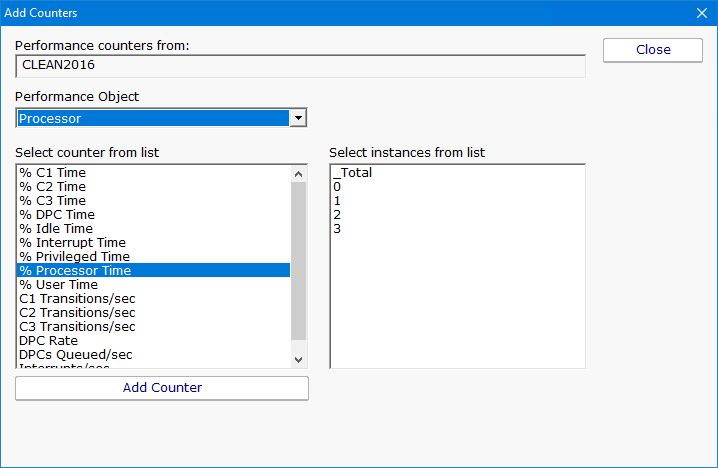
When adding a counter to be monitored, the target server is queried for counters it supports, and a dialog similar to the Windows Perfmon dialog is shown where you can select the counter that you want to monitor. Servers monitored by Satellites will also be queried immediately for their counter lists.

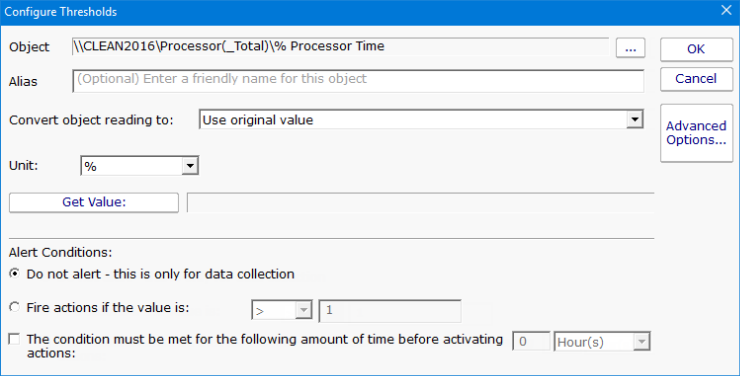
Once a counter has been chosen, alerting criteria are specified. A threshold (low or high) and the amount of time the threshold has to be exceeded before actions are fired can be given. If the theshold is passed, the offending counter and its current value will be part of the action description.

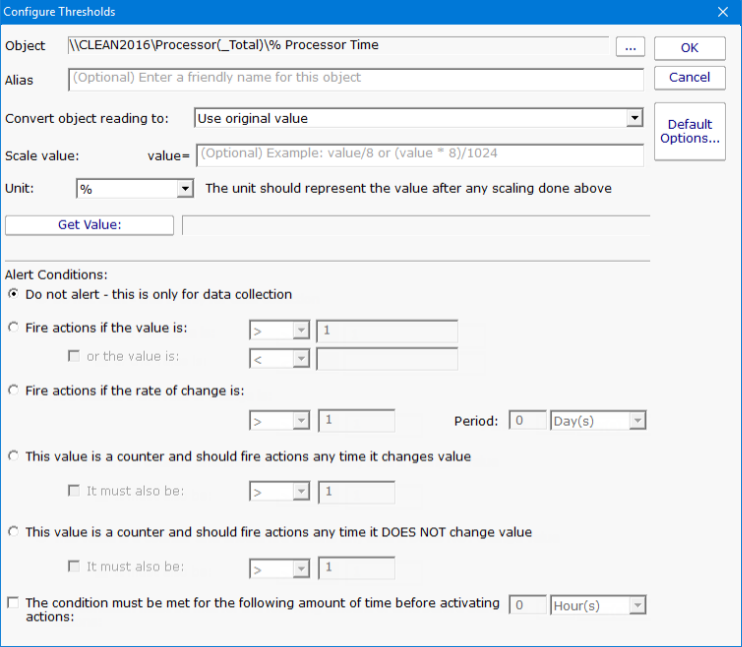
If you choose the Advanced Options button, the dialog changes and you are given richer threshold options, which include rate of change, checking for values within a range, or not alerting at all and just collecting data.

Each time a performance counter is measured and checked, it is also recorded in a database in order to generate historical reports.
For the charting to work correctly, it's important to specify the correct unit of the counter. The monitor will correctly correctly guess the unit for some common counters, but you will need to set it for others.
If the counter value cannot be represented by an existing unit, you might be able to scale it. For example, imagine the counter is MBps, but the available unit is Mbps. To correctly record the value, you should set the scale to:
and then set the unit to Mbps
Many counter paths have an instance value. Using the Network Interface counter as an example, these two counters might be on a computer:
The instance is the part between the ( and ), so in this example, the instances would be:
Sometimes you want to monitor an object, but don't know what the instance might be named (very common with the Network Interface scenario). This can happen if you're trying to copy the monitor, or setup a monitor template. In that case, click the "..." button next to the path, and change the instance to *
In our example, a monitor that could watch both example counters (or others found on other computers) could use the following path:
When the monitor runs, it will replace the * with each instance it finds of that counter type, and then monitor and record the instance-specific value.
The instance can be replaced with * and ? with other letters and numbers, where * means any characters and ? means any single character. So you could for example use:
Regular Expressions
The instance can also use Regular Expressions besides just * and ?. To use them, the format needs to be
For example, the following example will watch all ASP.NET Application Pools, except for the _Total instance:
The regular expression above will match any app pool name that starts with A-Z, a-z or 0-9. _Total does not match that.

The Performance monitor can create charts from any of the counter values that are being monitored. This includes bar and line charts. Tabular HTML and .CSV output for importing into other apps (Excel) are also possible.
In addition, the Server Status Report can be configured to show charts for any value that is monitored.
Like all monitors, this monitor has standard buttons on the right for Adding Actions, setting Advanced Options and setting the Monitor Schedule.