- Solutions
-
- File Server: Ransomware Protection
- File Server: File Copy
- File Server: Audit File Access
- File Server: Storage growth reporting
- Licensing/Pricing
- Contact
The Bandwidth Monitor can retrieve data from SNMP counters (ifTable and ifXTable) and from Windows (Network Interface counters). Different types of data (data rates, error counts, etc) can be monitored, recorded, and alerted on.
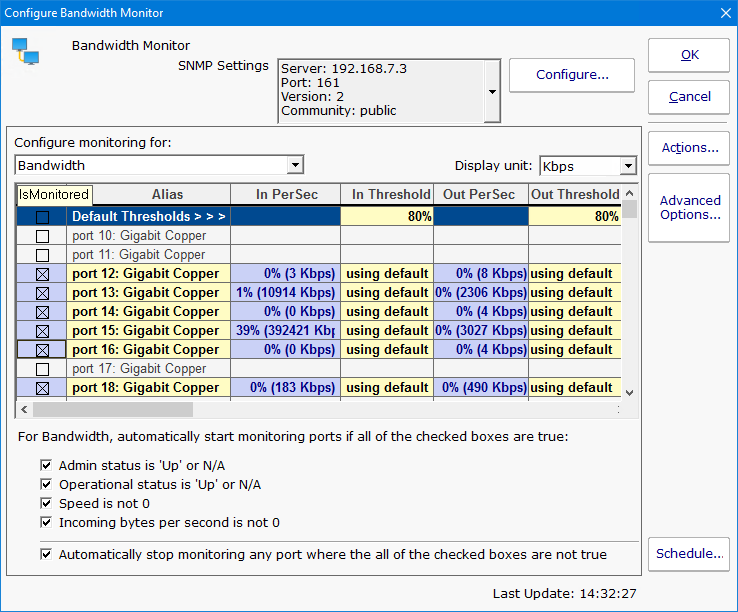
The configuration dialog above shows the Bandwidth Monitor. Notice the drop drop-down menu has selected Bandwidth as the values that are being shown. It can be set to one of the following values:
Each Bandwidth Monitor can watch one of the value types above. If you wanted to watch Bandwidth and Error Counts for example, create two Bandwidth Monitors.
The Bandwidth value needs a unit (Bps, MBps, etc) which can be specified. The other counter types are simply a counter value.
In the discussion below, ports will be referred to as switches are often monitored. If a Windows computer is being monitored, ports would refer to network interfaces.
The grid shows the different ports that were found when inspecting the device. You can change the port name to an alias that is more meaningful.
The first port, IsMonitored, indicates whether a port is being monitored. Ports that are monitored get a different color. Cells that are yellow can be edited. That means the Alias, and In Threshold and Out Threshold columns can be changed for monitored ports.
For each port, the current incoming and outgoing value are shown, and an optional threshold value that you can set.
By scrolling to the right, there are more columns as shown below.


The Alert After column lets you indicate how long a port has to be over its threshold before alerting. Values are set in minutes and should be specified like "1 Minute" or "15 Minutes".
In addition, values such as the port's speed, operational and admin status are shown. Description and Name are retrieved and cannot be changed. Since Windows does not support these values, N/A will be shown for Op Status, Admin Status, Type and Connected.
The last two columns are just for diagnostic purposes - they show the raw per-second value coming from the counter, without any units being applied.
For a large switch, or for counters coming from a computer where network hardware is changed, the available ports be added or removed, or their status might change (from being used to no longer in use, etc). The check boxes at the bottom of the monitor enable automatic monitoring of newly added/active ports, or to stop monitoring removed/disabled ports.
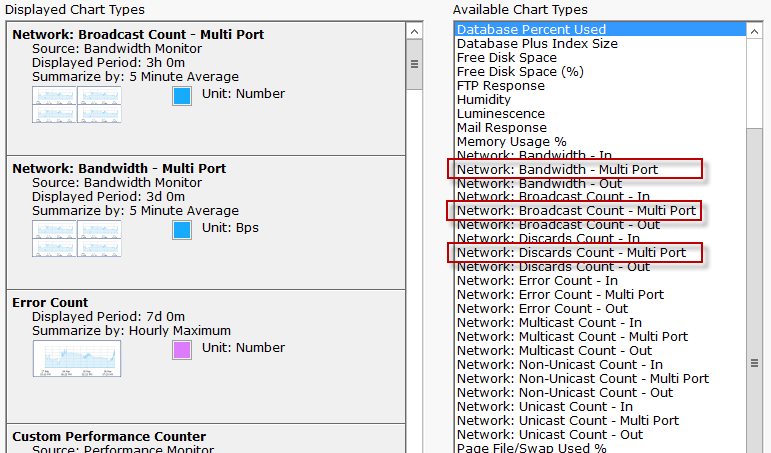
Most monitors can show configurable charts for data that is retrieved. The Bandwidth Monitor can show charts for each kind of data that is retrieved (Bandwidth, Error Count, etc). Because the Bandwidth monitor can track so many ports, and this data is frequently charted, a special Multi-Port chart is available to show the bandwidth data together. Examples are shown below (this image comes from the chart configuration screen).
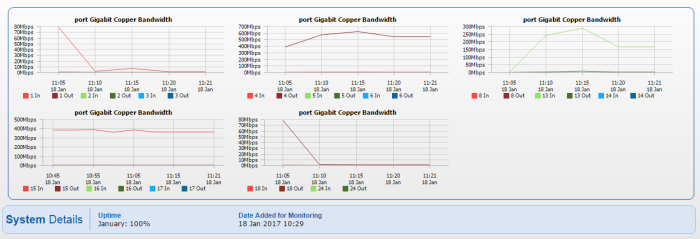
The Multi-Port chart creates a large chart area with multiple charts within it. Ports, and their input/output values can be grouped together in a variety of ways.
The configuration dialog for the Multi-Port chart is larger than most, so we'll split it in half and look at each half separately.
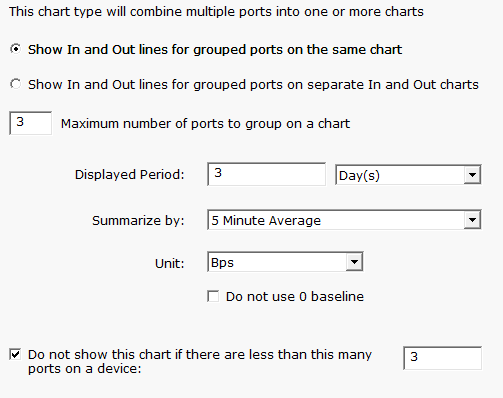
The first half of the dialog controls grouping. Each port has an input and an output value. Some customers want to see all inputs on one chart, and all outputs on a separate chart. Both options are possible. In addition, because showing a large number of ports on each chart would make it hard to read, you can indicate only a certain number should be shown. Additional charts will be created as needed to handle all of the ports.
Also note that if a device has fewer than a specified number of ports (3 in this example), the Multi-Port chart won't be used. This allows you to specify a Multi-Port chart at a high level (at Servers/Devices) and if the chart is not appropriate (perhaps for computers where only a single NIC is being monitored) it won't be shown. In addition, if a port is shown in the Multi-Port chart, it won't also be shown in a separate single-port chart (like Network: Bandwidth In).
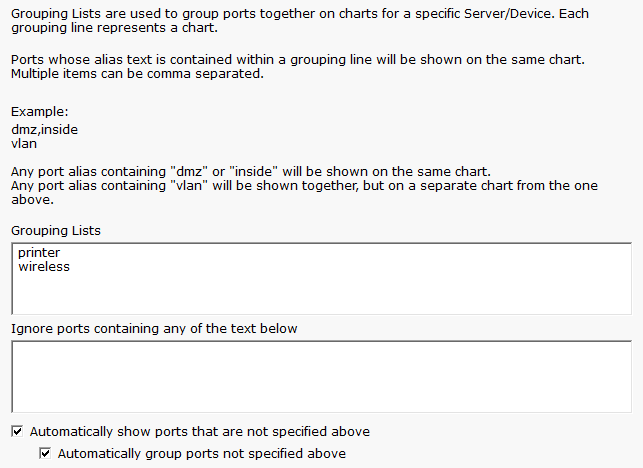
The second half of the dialog lets us control how the ports are grouped together. By default they are grouped together numerically (i.e. the first X ports are together, and then the next X ports, etc). You can group the charts based on their alias. In the example above, any ports that have 'printer' in their alias will get grouped together into a chart, and any that have 'wireless' in their alias will get grouped together in a separate chart.
In addition, ports can be ignored and not charted at all, again based on the alias.
Like all monitors, this monitor has standard buttons on the right for Adding Actions, setting Advanced Options and setting the Monitor Schedule.