- Solutions
-
- File Server: Ransomware Protection
- File Server: File Copy
- File Server: Audit File Access
- File Server: Storage growth reporting
- Licensing/Pricing
- Contact
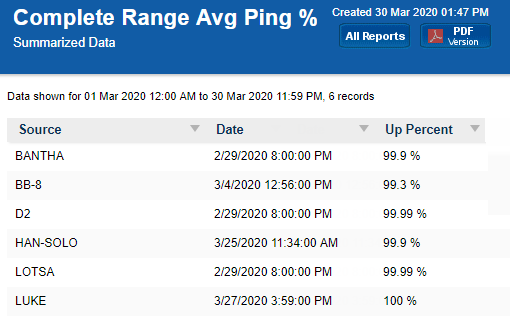
Many monitors have Uptime reports which show graphically any down time reported by that monitor (for the Ping and Service monitors for example). You can also create a summary uptime report like the one shown below.

The basic solution is to create an Uptime report, with a tabular output, for multiple data sets. The secret is to summarize the data using the "Complete Range" summarization rule -- that is what gives you one line per monitor. Details shown below.
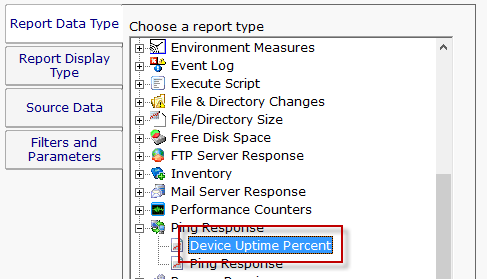
First, select the Uptime report for the data that you want to report on. In this case, we'll choose the Ping Uptime report.

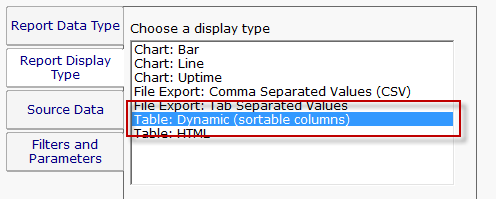
Next, choose a display type. The Tabular Report, HTML Table Report or CSV Export types will work fine.

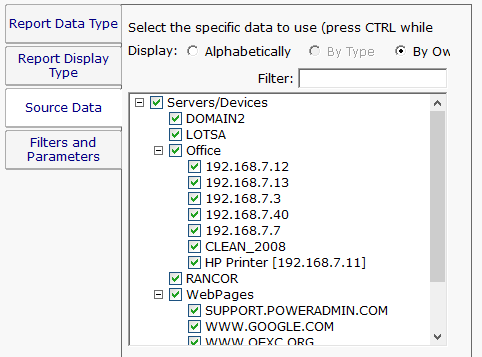
Choose the server/devices that you want to report on. You can select the top group node to select all servers/devices. NOTE: Each selected server/device has to be queried separately in the database, so a large selection can make the report take a while. Once you get the report how you like it, create a Scheduled Report so the report is run and ready before you need it.

The report parameters are the key step here. Choose the time period for the report, and then chose Complete Range for the summarization period. This will average all the data between the two dates and come up with an overall Uptime percent.
