- Solutions
-
- File Server: Ransomware Protection
- File Server: File Copy
- File Server: Audit File Access
- File Server: Storage growth reporting
- Licensing/Pricing
- Contact
This help page is for version 9.5. The latest available help is for version 9.6.
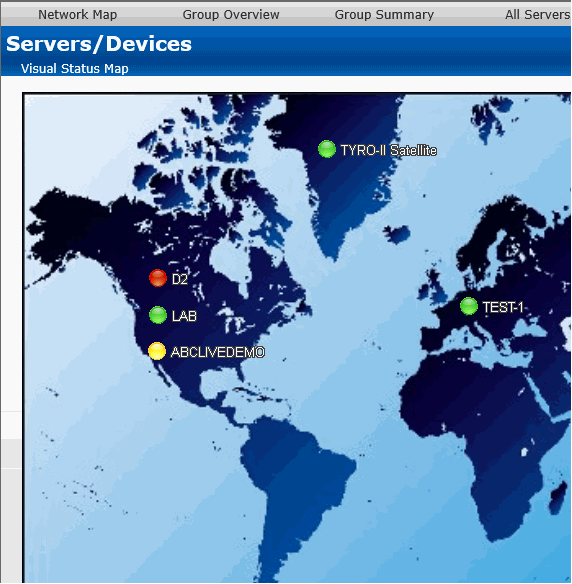
The Visual Status Map is one of the available group level reports. The map display allows you to easily see the status of servers and server groups that you have placed on a map or other graphic. This type of display can beneficial in determining network problems that are geographically significant due to server locations.
To see the Visual Status Map, select a group in the Navigation Window and click the "Map" link in the gray menu bar at the top of the report.
The following report is what a typical Visual Status Map might look like:

The map appearance and the positions and style of the status indicators can be configured in the Status Map Editor Dialog. There are several maps of different areas around the world, and you can also add your own map grapic.
The map graphic and the server icons will stretch to fit the available browser window space.
The colors displayed by the status indicators correspond to the "worst" monitor state of all monitors on the computer (or for all monitors within the computer group). In other words, the presence of one monitor in an alert state for a given computer will cause its indicator to display in yellow. A "green" status indicates that the computer has no detected problems.
Group status reports can be configured to auto-rotate among reports. See Group Report Settings.