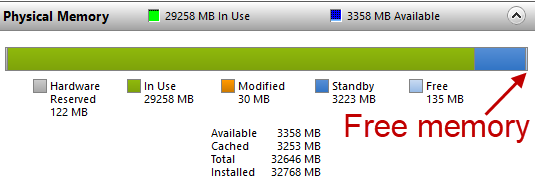
When you look at Task Manager, it’s hard to compare it to any counter you see in Performance Monitor. The reason is there are many ways to discuss memory usage and it’s cousin free memory. If you think about it, you really don’t want your computer to have free memory laying around. That would represent computer resources the computer could be using but isn’t. When we look at the memory usage in Resource Monitor, we see that Windows keeps very little “free memory” around.
“Standby” memory is a little more interesting. It is in use, but could be given up if something more important came along. It turns out that Task Manager’s “Memory Usage” display is really the total amount of physical memory minus this Standby memory and Free memory. There isn’t a Performance Counter that gives this same value, but we can get close in PA Server Monitor.
\Memory\Available MBytes is a close approximation to the Standby and Free memory. Its definition is:
Available MBytes is the amount of physical memory, in Megabytes, immediately available for allocation to a process or for system use. It is equal to the sum of memory assigned to the standby (cached), free and zero page lists.
The counter \Numa Node Memory\Total MBytes is the closest counter that exists that represents the physical installed memory. It is defined as:
Total amount of physical memory associated with a NUMA node in megabytes.
Note that this counter is only available on 64-bit versions of Windows.
With these two counters we can calculate Task Manager’s notion of Memory Usage with:
Memory Usage = (100 * (Total MBytes – Available MBytes))/Total MBytes.
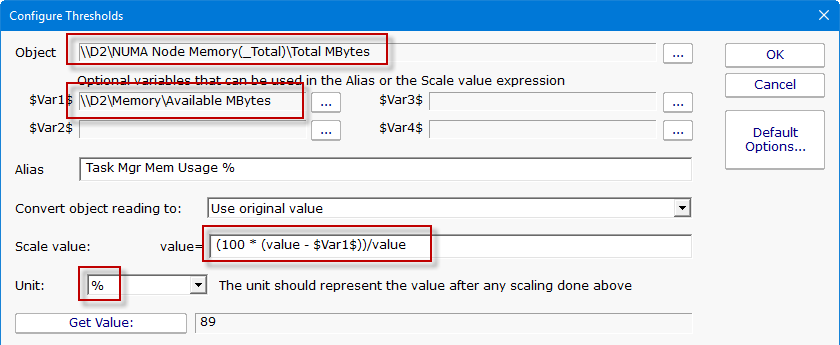
This can be done in the the PA Server Monitor Performance Monitor using the Advanced Options and a variable as pictured:
Be sure to change the values highlighted above in your monitor.
I like to set an alias of “Task Mgr Memory Usage %” so I know what this value is being shown in charts.

